One of the classic problems in software development is to accurately estimate how many developers are needed to complete a task. In my 15+ years of commercial software development in small and large companies, I've yet to come across a project where the resource estimate at the beginning of the project ended up being anywhere close to being correct. Invariably the estimate is much lower than what it actually takes to complete the project. Why is this? I think it is because some of the intangible aspects of developer efficiency are overlooked in the resource estimation process.
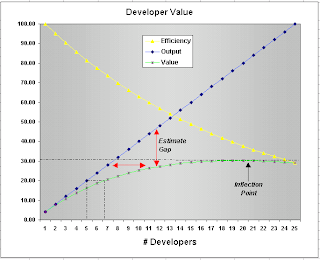
What is the optimal size of a developer group engaged in a project with shared, common, inter-dependent tasks? I believe the optimal size is 1! One brilliant developer with all the required skills produces software in the most efficient fashion. Of course, it is going to take forever for a team of one developer to complete any reasonable size project, and obviously most teams need to have more than one developer. My thesis is that with every additional developer, efficiency of the group decreases by 5% over the previous level. So if a team of 1 developer works at 100% efficiency, a team of 2 developers works at 95% efficiency (0.95 x 100), a team of 3 developers works at 90.25% efficiency (0.95 x 95), a team of 4 developers works at 85.74% efficiency (0.95 x 90.25), and so on. This is shown graphically in Figure 1 below where the yellow line indicates the decrease in efficiency level as the number of developers increases.
Figure 1. Developer Value
Why is it that efficiency decreases as the number of developers increases? The decrease is due to many factors. The principal factor is related to source code dependency and version management. When a group of developers share a common code base, there is invariably inefficiencies related to:
- module inter-dependency ("my change broke his code"), and
- code sharing ("I have to rebase to his changes first before delivering my changes to the same file").
- difficulty in ensuring a common understanding of the project design goals and principles ("I thought you meant this rather than that 3 months ago"),
- differing developer backgrounds, styles and skill levels ("this guy's code is so cryptic, I'd rather re-write it than try to figure it out"), and
- the increasingly distributed nature of development with language, culture and time-zone related communication problems ("wish I could quickly and easily get this guy in Bangalore or Minsk to understand exactly what I mean")
As the number of developers increases, the output obviously increases. This increase is linear and is shown graphically in Figure 1 as the blue line. However, this output does not factor in the cost of inefficiencies mentioned above. The inefficiencies introduce a cost penalty that needs to be factored in to the calculation of true "developer value". This value is shown in Figure 1 as the green line. Note that the rate of increase of developer value is lower than the rate of increase of developer output as the number of developers increases. Resource estimates are typically based on the output curve, when in fact they should be based on the value curve. The difference between the output curve and the value curve is called the "estimate gap" and is indicated by red double-arrow lines between the blue (output) and green (value) curves. Missing this estimate gap is the reason for poor and lower estimation of required resources for projects.
So what does this value curve mean? Let's say you estimate that you need 5 developers to complete a task based on amount of code that needs to be written. In Figure 1, assume that the y-axis is re-scaled so that 20% output is 100% for your task - so 5 developers are estimated to be required to complete 100% of the task. From the output and value curves, you actually need 6.7 developers when you factor in the estimate gap. The table below shows the mapping between estimated number of developers based on output and required number of developers based on value. This mapping can be used to arrive at more accurate resource estimates without just going with the incorrect estimate based on output.
| # Developers Estimated (Output) | # Developers Actual (Value) |
| 1 | 1 |
| 2 | 2.1 |
| 3 | 3.3 |
| 4 | 5 |
| 5 | 6.7 |
| 6 | 9 |
| 7 | 13 |
An interesting aspect of the value curve is that there is an inflection point around 21 developers (indicated in Figure 1) after which the value actually starts decreasing! This means that a group of 21 or more developers working on shared, common, inter-dependent project tasks is likely to be a loss making proposition. In terms of estimated number of developers based on output corresponding to 21 developers based on value, the number turns out to be between 7 and 8. This means that if your estimate arrives at more than 7 developers based on output (which is more than 13 developers based on value), you run a huge risk of failure. In such a scenario, re-visit your project tasks and try to break it up into more independent sub-projects. If that is not possible, you are dealing with an immensely complex software system that given today's state of the art, is impossible to build effectively. Hopefully such systems are rare.
So for your next project, bridge the estimate gap to arrive at better resource estimates, and remember the magic upper limit numbers - 7 and 13.


No comments:
Post a Comment